Tutorial: Publishing data rich documents on DataHub
Hi, we just released a tutorial on the basics of publishing a data rich document.
Live tutorial:
https://demo.datahub.io/@datahubio/tutorial
Demo video:
But wait, what is a data rich document?
A data rich document is a document in which the writer can easily mix formatted text content with data visualizations. This means that you don't have to code nor embed your charts and tables, those can be added to the document with a very simple syntax, passing inline-data or simply referencing your data files. What you end up with is a plain text, human-readable document which is simple to edit and looks awesome when rendered in DataHub!
What does this syntax looks like?
The structure and text formatting of the documents are created with markdown (take a look at this guide to learn more about markdown). But it's not simply markdown, it's markdown on steroids: writers are capable of easily adding tables of content, mathematical formulas, data visualizations and more!
That's why it's possible to add a chart like this one:
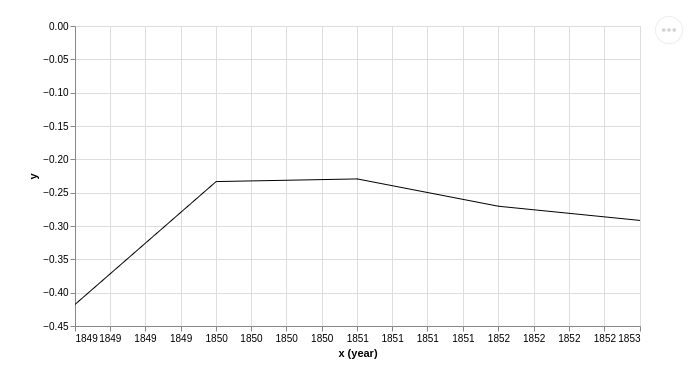
Using just a simple snippet:
<LineChart data={
    [
      ["1850",-0.41765878],
      ["1851",-0.2333498],
      ["1852",-0.22939907],
      ["1853",-0.27035445],
      ["1854",-0.29163003]
    ]
} />
What is a DataHub project?
A DataHub project is simply a GitHub repo with a README and, potentially, data files. That's right: you can take advantage of everything that GitHub offers in terms of revisioning, changes history and so on and transform your repo into a data rich document.
Imagine how cool it would be to store your reports, datasets and analysis in this format. Now, let's learn how to actually do it.
Now, head to the live tutorial to create your own DataHub project